Load Balancing and failover policy allows you to define how the network traffic distributed between physical network adapters and how to reroute the traffic in case of network adapter failure. There are 5 types of network load balancing policies available with vSphere distributed switch. Let's discuss in details about each load balancing policy. Load Balancing Policy available at vSwitch and dvSwitch is only to control the Outgoing traffic
![]()
![]()
![]()
In the above diagram, You can see the different uplinks are chosen based on the hash of the source and destination IP address.
Hash of A & X associated with Uplink1
Hash of A & Y associated with Uplink2
Hash of B & Y associated with Uplink3
Hash of B & Z associated with Uplink3
Above diagram will clearly explains how the physical uplink adapters will be chosen using Load based on IP hash load balancing policy.
![]()
Hash of VM A vNIC's MAC is associated with Uplink 1
Hash of VM B vNIC's MAC is associated with Uplink 2
Hash of VM C vNIC's MAC is associated with Uplink 3
![]()
![]()
![]()
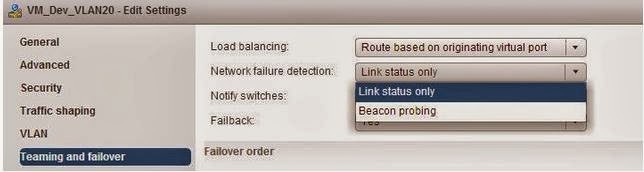
1. Route based on originating Virtual Port
2. Route based on IP hash
3. Route based on originating virtual Port
4. Use Explicit failover order
5. Route based on Physical NIC load

Route based on originating Virtual Port
This is the default load balancing policy. Virtual Switch consists of number of virtual ports. In this load balancing policy, Virtual ports of the vSwitch are associated with the Physical network adapter. This physical network adapters are determined by the virtual Port ID in which the virtual machine is connected. Traffic from that particular virtual machine virtual Ethernet adapter is consistently sent only to the same Ethernet adapter until and unless there is a failure of that particular physical Ethernet adapter. In that case, There will be a failover to another physical adapter in the NIC team. Network replies will also be received on the same physical adapter as the physical switch learns the port association.
Route based on IP Hash
If this Load balancing policy is configured, Physical Nic for outbound packet is chosen based on its source and destination IP address. Physical uplink will be selected based on the hash of the source and destination IP address of the each packet sent from the VM. This method need higher CPU overhead.
Hash of A & X associated with Uplink1
Hash of A & Y associated with Uplink2
Hash of B & Y associated with Uplink3
Hash of B & Z associated with Uplink3
Above diagram will clearly explains how the physical uplink adapters will be chosen using Load based on IP hash load balancing policy.
Route based on Source MAC Hash
In this load balancing policy, Each Virtual machine outbound traffic will be mapped to a particular physical NIC based on the hash of Virtual Machine NIC's MAC address. Traffic from a particular virtual NIC is consistently sent to the same uplink adapter unless there is failure of that particular uplink adapter. Even replies are received on the same physical adapter.
Hash of VM A vNIC's MAC is associated with Uplink 1
Hash of VM B vNIC's MAC is associated with Uplink 2
Hash of VM C vNIC's MAC is associated with Uplink 3
Route based on Physical NIC load
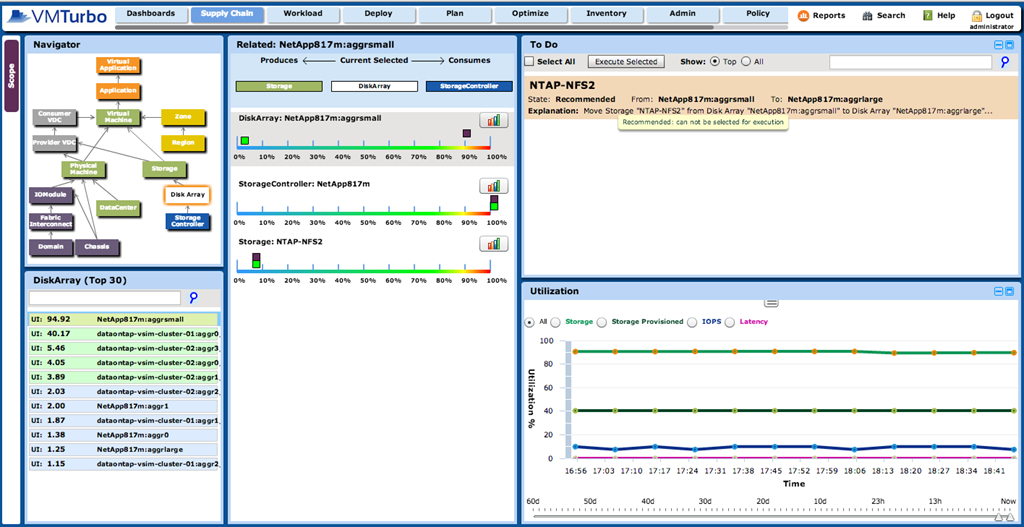
This load balancing policy is only available as part of dvSwitch and it is not available in Standard switches. This policy chooses a uplink based on the current load of the physical network adapters. This load balancing policy use a algorithm to perform a regular inspection of load on the Physical NICs every 30 seconds. When the utilization of Particular physical uplink exceeds 75% over 30 seconds, the hypervisor will move VM's traffic to another uplink adapter. This load balancing doesn't require any additional configuration at the physical switch level.

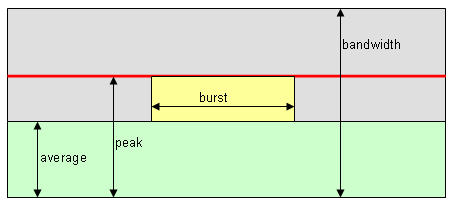
This load balancing policy provides better utilization of all the uplink adapters and does perfect load balancing. Please find the below test case results dvUplinkswith the network bandwidth usage on 2 Uplink adapter during the entire benchmark period. This load balancing policy provides even distribution of network load on both physical uplink adapters.

Graphic Thanks to VMware.com
Use Explicit Failover Order
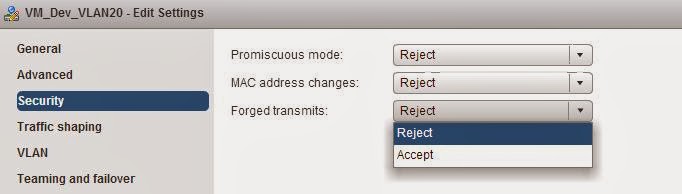
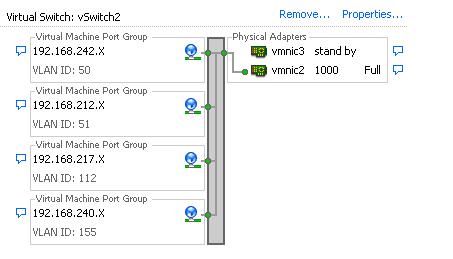
This setting always use the highest order uplink from the list of Active uplink adapters. In case of failover or both the active uplink adapters failed, Standby adapters will be used. Move the adapters up and down based on the requirement. uplinks adapters under Unused uplink will not used for the communication.

I hope this is informative for you. Thanks for Reading!!!. Be Social and share it in social media if you feel worth sharing it.